Grafana and Prometheus are the standard open-source pair for server metrics. Prometheus collects and stores numbers such as CPU, memory and disk, and Grafana draws them and sends alerts. Self-hosting them on a VPS takes about 40 minutes, and the part most guides get wrong is who can reach the data.
Using an AI coding agent? There's a ready-made prompt at the end of this guide. Copy that instead of this article.
The mistake to avoid before you start
Most example compose files publish Prometheus on 9090 and node_exporter on 9100 to the whole internet. Don't copy that.
Prometheus has no login of its own, and its security documentation says the components should not be exposed to publicly accessible networks. Anyone who can reach port 9090 can run queries against everything you collect. node_exporter is the quieter leak. It answers on 9100 with hardware, kernel, mount and network detail for the machine, to anyone who asks. That is free reconnaissance for an attacker.
So the rule for this guide is simple. Only Caddy publishes ports, and only to serve Grafana over HTTPS behind a login. Prometheus and cAdvisor publish nothing, and node_exporter is closed by the firewall.
One detail explains the design. Ports published by Docker bypass ufw, so a firewall rule alone does not protect a published port. A service on the host network is not published that way, and ufw does govern it. We use each where it fits.
Metrics are not uptime checks
Uptime Kuma asks one question from outside: does this answer right now? Prometheus asks a different one from inside: what has this machine been doing for the last month? Kuma tells you the site is down. Prometheus tells you the disk filled at 02:10, memory crept up for six days, or a container is restarting. You want both, and they should not run on the same server, which we come back to at the end.
What you'll need
- A PrivateByte VPS. The Orbit plan ($7.99/mo: 2 vCPU, 4 GB RAM, 50 GB SSD) is the honest pick. A handful of targets idle well under 2 GB of RAM, so Flare ($5.99/mo) will run a small setup, but the time-series database wants disk and headroom for heavy queries. Orbit gives you both.
- A domain name you control the DNS for.
- Optionally, other servers to watch, and a WireGuard tunnel to them.
- About 40 minutes.
Step 1: Deploy your VPS
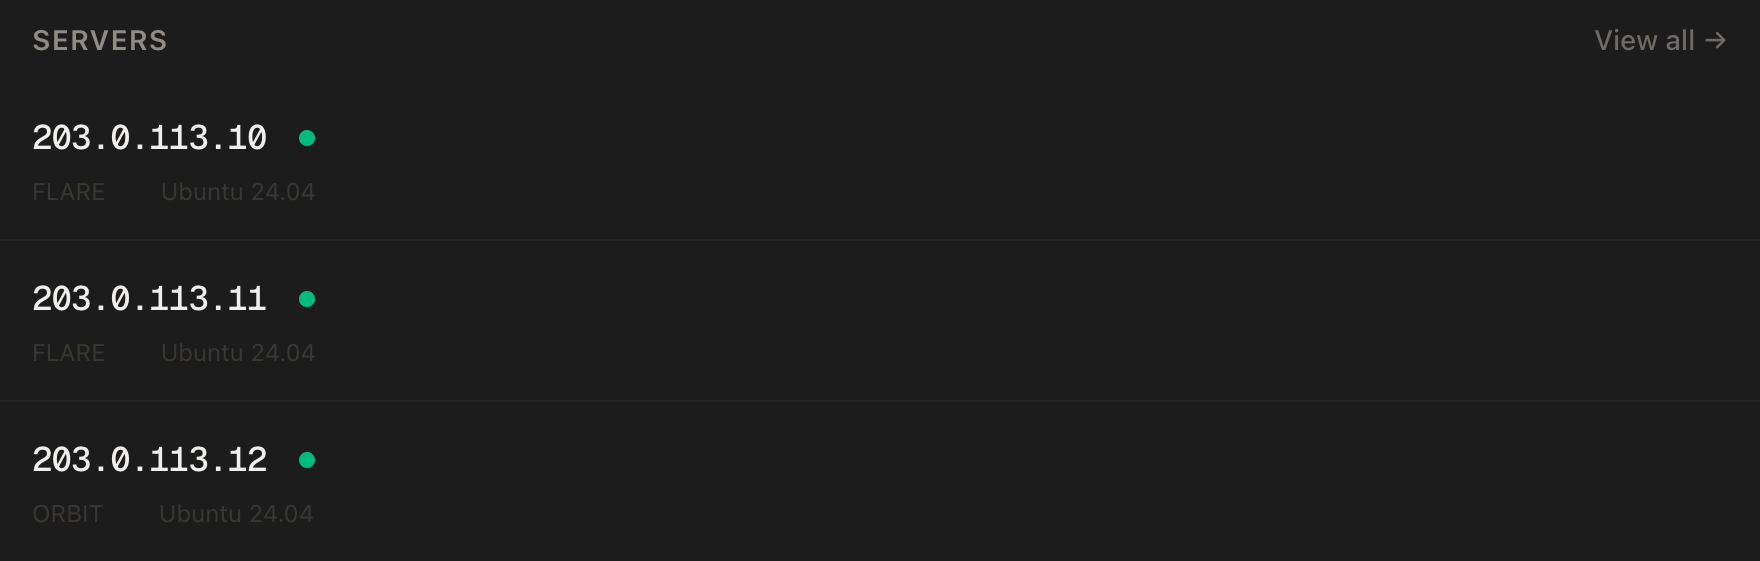
In the PrivateByte dashboard, open the store, choose Orbit, pick Ubuntu 24.04, and deploy. Usually ready in a few minutes.
Step 2: Point your domain at the server
| Type | Name | Value |
|---|---|---|
| A | grafana |
your server's IP |
dig +short grafana.yourdomain.comThat must return your server's IP before you continue.
Step 3: Connect over SSH
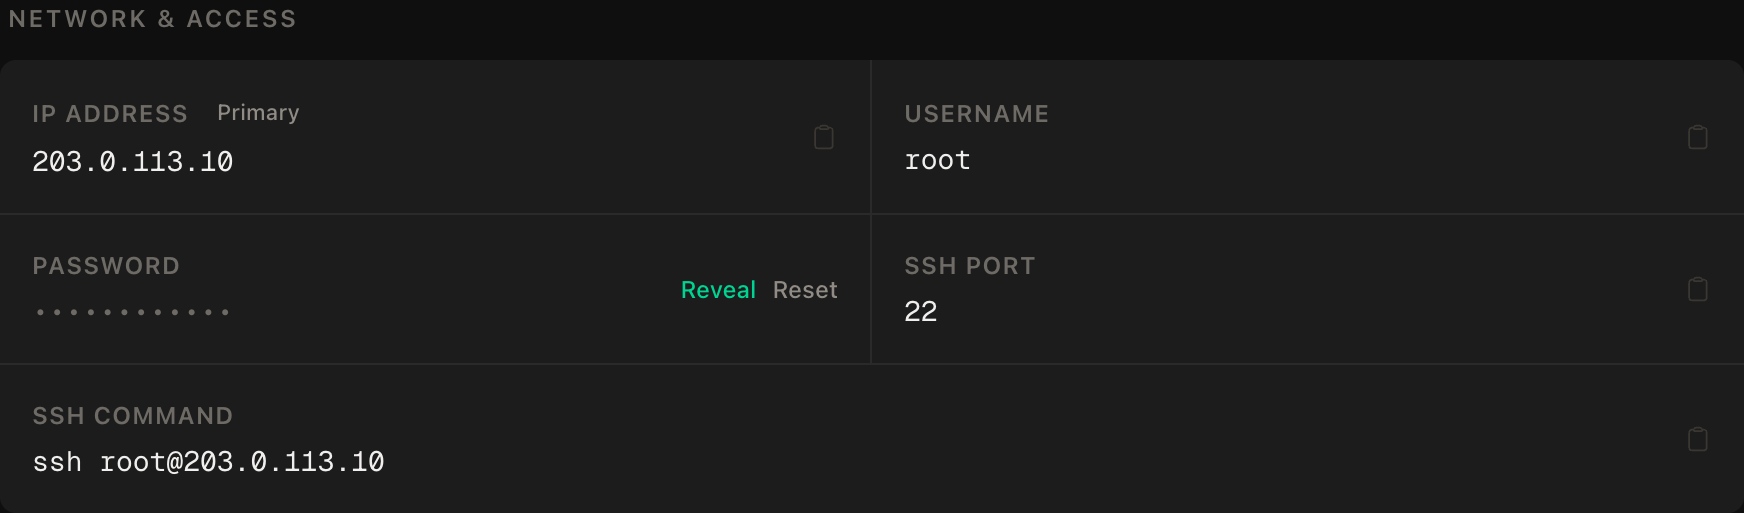
ssh root@YOUR_SERVER_IPWindows users: PowerShell has ssh built in, or use the browser console in the dashboard.
ssh command.Step 4: Install Docker
apt update && apt upgrade -y
curl -fsSL https://get.docker.com | sh
systemctl enable --now docker
docker --version
Step 5: Set up the firewall
SSH first, then the web ports, then one rule for the metrics path, then enable:
ufw allow OpenSSH
ufw allow 80/tcp
ufw allow 443/tcp
ufw allow from 172.28.0.0/24 to any port 9100 proto tcp
ufw --force enable
ufw status
The fourth rule is the careful one. node_exporter runs on the host network so it can see the real machine, which means it listens on every interface, including the public one. Prometheus lives in a container on a private Docker network and reaches it through that network's gateway address. This rule lets that one subnet in on 9100 and nobody else. Everything else stays denied by default.
Step 6: Write the configuration
mkdir -p ~/monitoring/grafana/provisioning/datasources && cd ~/monitoring
nano docker-compose.yml
services:
prometheus:
image: prom/prometheus:latest
restart: unless-stopped
command:
- --config.file=/etc/prometheus/prometheus.yml
- --storage.tsdb.path=/prometheus
- --storage.tsdb.retention.time=30d
- --storage.tsdb.retention.size=20GB
volumes:
- ./prometheus.yml:/etc/prometheus/prometheus.yml:ro
- prometheus_data:/prometheus
networks: [monitoring]
grafana:
image: grafana/grafana:latest
restart: unless-stopped
environment:
GF_SECURITY_ADMIN_USER: admin
GF_SECURITY_ADMIN_PASSWORD: ${GRAFANA_ADMIN_PASSWORD}
GF_AUTH_ANONYMOUS_ENABLED: "false"
GF_SERVER_ROOT_URL: https://grafana.yourdomain.com
volumes:
- grafana_data:/var/lib/grafana
- ./grafana/provisioning:/etc/grafana/provisioning:ro
networks: [monitoring]
node-exporter:
image: quay.io/prometheus/node-exporter:latest
restart: unless-stopped
network_mode: host
pid: host
command:
- --path.rootfs=/host
- --collector.systemd
- --collector.processes
volumes:
- /:/host:ro,rslave
cadvisor:
image: ghcr.io/google/cadvisor:0.55.1
restart: unless-stopped
privileged: true
devices:
- /dev/kmsg
volumes:
- /:/rootfs:ro
- /var/run:/var/run:ro
- /sys:/sys:ro
- /var/lib/docker/:/var/lib/docker:ro
- /dev/disk/:/dev/disk:ro
networks: [monitoring]
caddy:
image: caddy:2-alpine
restart: unless-stopped
ports:
- "80:80"
- "443:443"
volumes:
- ./Caddyfile:/etc/caddy/Caddyfile:ro
- caddy_data:/data
- caddy_config:/config
networks: [monitoring]
networks:
monitoring:
ipam:
config:
- subnet: 172.28.0.0/24
volumes:
prometheus_data:
grafana_data:
caddy_data:
caddy_config:Read the compose file for what is missing. Only Caddy has a ports: section. Prometheus, Grafana and cAdvisor are reachable only inside the Docker network. The pinned subnet is what makes the firewall rule and the scrape address exact.
A few choices are worth understanding. The retention flags set two ceilings. --storage.tsdb.retention.time=30d keeps a month, and Prometheus defaults to 15 days if you set nothing. --storage.tsdb.retention.size=20GB is a safety cap that drops the oldest data first. The Prometheus docs advise setting the size at no more than 80 to 85 percent of the disk it lives on, which is why 20 GB sits comfortably inside 50. cAdvisor is optional and genuinely privileged, so delete that service if you do not need per-container numbers. The node_exporter flags --collector.systemd and --collector.processes are the ones the dashboard page recommends. The latest tags are fine for a first run, but pin to a specific release once it works so an upgrade is a decision.
Create the password file. The admin password is applied only on the first start, so choose it now:
echo "GRAFANA_ADMIN_PASSWORD=$(openssl rand -base64 24)" > .env
chmod 600 .env
Now the Prometheus scrape configuration:
nano prometheus.ymlglobal:
scrape_interval: 15s
scrape_configs:
- job_name: prometheus
static_configs:
- targets: ['localhost:9090']
- job_name: node
static_configs:
- targets: ['172.28.0.1:9100']
labels: { host: monitor }
# Step 10 adds remote servers here, for example:
# - targets: ['10.8.0.2:9100']
# labels: { host: web1 }
- job_name: cadvisor
static_configs:
- targets: ['cadvisor:8080']Putting every machine under the one node job matters, because the Node Exporter Full dashboard expects a job with that name. A host label tells them apart.
The Grafana data source is provisioned from a file, so there is nothing to click:
nano grafana/provisioning/datasources/prometheus.ymlapiVersion: 1
datasources:
- name: Prometheus
type: prometheus
access: proxy
url: http://prometheus:9090
isDefault: true
editable: falseAnd the Caddyfile:
nano Caddyfilegrafana.yourdomain.com {
reverse_proxy grafana:3000
}Step 7: Start it
docker compose up -d
docker compose ps
docker compose logs caddy | tail -20
All five containers running, and a line confirming the certificate was obtained. Repeated certificate failures usually mean DNS has not propagated.
Step 8: Log in and import the dashboard
Open https://grafana.yourdomain.com and log in as admin with the password from .env (cat .env). Grafana's built-in default is admin, which is why the compose file overrides it. Check the lock-down too: open the site in a private window and confirm you get a login form and no dashboards. Anonymous access is off unless someone enables it, and we set it off explicitly so it stays that way.
Then go to Dashboards, Import, type 1860 and load it. That is the community dashboard Node Exporter Full, which draws nearly everything node_exporter reports. Pick the Prometheus data source and import. Choose your host in the dropdown and CPU, memory, disk and network graphs fill in within a minute or two.
Step 9: Add an alert that reaches your phone
A dashboard nobody watches is not monitoring. Create a bot with BotFather in Telegram, copy its token, add the bot to a chat and find the numeric chat ID. Then in Grafana go to Alerting, Contact points, Add contact point, choose Telegram, paste the token and chat ID, and press Test. Do not skip the test. An alert path you have never fired is an assumption.
Next create an alert rule. Under Alerting, Alert rules, add one with the Prometheus data source and this query:
(1 - node_filesystem_avail_bytes{mountpoint="/",fstype!="tmpfs"} / node_filesystem_size_bytes{mountpoint="/",fstype!="tmpfs"}) * 100Set the condition to fire above 85, put it in an evaluation group, give it a pending period of five minutes so a brief spike does not wake you, and choose the Telegram contact point. A second rule on up == 0 tells you when a target stops answering, which is the one most people forget.
Step 10: Watch another server over WireGuard
This is where the setup earns its keep. Set up a WireGuard tunnel between this server and the one you want to watch, so each has a private address, say 10.8.0.1 here and 10.8.0.2 there.
On the remote server, run node_exporter bound to its tunnel address only, never to the public one:
docker run -d --name node-exporter --restart unless-stopped \
  --net=host --pid=host -v /:/host:ro,rslave \
  quay.io/prometheus/node-exporter:latest \
  --path.rootfs=/host --web.listen-address=10.8.0.2:9100
Prometheus pulls the numbers across the tunnel. Add the target to the node job in prometheus.yml, then reload:
docker compose restart prometheusNow the exporter is unreachable from the internet, and traffic between the two servers is encrypted. If you cannot run a tunnel, node_exporter supports TLS and basic auth through --web.config.file, but a private address is simpler and leaves less to get wrong.
Verify it works
Check the targets page from inside the server, since Prometheus is not published:
docker compose exec prometheus wget -qO- http://localhost:9090/api/v1/targets | grep -o '"health":"[a-z]*"'Every target should read up. Then the negative controls, run from your own machine, not the server:
curl -m 5 http://YOUR_SERVER_IP:9090
curl -m 5 http://YOUR_SERVER_IP:9100/metrics
curl -m 5 http://YOUR_SERVER_IP:3000
All three must fail or time out. If any answers, something is exposed, and you should stop and fix it before anything else.
Then test the alert for real. Stop one exporter with docker compose stop node-exporter, wait out the pending period and confirm the up == 0 message arrives on Telegram. Start it again and confirm recovery. Finally run reboot, wait a minute, and confirm the dashboards come back on their own.
How much disk and RAM it needs
Prometheus documents the sizing formula: retention in seconds, times samples ingested per second, times bytes per sample, and it stores one to two bytes per sample on average. As an illustration, four targets with roughly a thousand series each, scraped every 15 seconds, is about 270 samples a second. Over 30 days that is well under 2 GB. Your real number depends on how many series each exporter produces, so check the prometheus_data volume with docker system df -v after a week and extrapolate. The 20 GB size cap means it can never fill the disk, whatever happens.
RAM grows with the number of series and the cost of queries, not the retention window. A handful of servers stays small. Dozens of servers with many containers is the point to move up a plan.
Who watches the watcher
If this server dies, Grafana cannot tell you, because it died with it. This is the same trap as any monitor on its own box. Run Uptime Kuma on a separate small server and point an HTTP check at your Grafana address. Metrics explain what happened. The external check tells you it happened at all.
Troubleshooting
A target shows down with "context deadline exceeded" or "no route". For the local node target, the ufw rule from Step 5 is missing or the subnet differs from the compose file. For a remote one, check the tunnel is up and the exporter is bound to the tunnel address, not 127.0.0.1.
Dashboard panels say "No data". The data source is wrong, or the dashboard expects a job named node and yours differs. Check the job name in prometheus.yml.
Telegram test works but real alerts never arrive. The rule is not routed to that contact point, or its pending period has not elapsed yet.
The admin password change did nothing. Grafana applies the admin password only on first run. Change it in the profile page afterwards, or remove the grafana_data volume if the instance is brand new.
Do it with an AI agent
If you'd rather hand this to Claude Code, Cursor, or another coding agent, don't paste the article at it. Copy this instead, and run it from your own machine with your agent able to SSH out.
Prompt for an AI agent
Set up Prometheus, Grafana, node_exporter and optionally cAdvisor on a fresh
Ubuntu 24.04 VPS with Docker, with Caddy providing HTTPS for Grafana only.

FILL IN BEFORE YOU START:
- SERVER_IP = <VPS IP from the PrivateByte dashboard>
- DOMAIN    = <Grafana subdomain, e.g. grafana.example.com>
- WANT_CADVISOR = <yes or no>

WHAT TO DO:
1. Run "dig +short DOMAIN" and confirm it returns SERVER_IP. If not, STOP.
2. SSH to root@SERVER_IP. Confirm Ubuntu 24.04 before changing anything.
3. apt update && apt upgrade -y. Install Docker from https://get.docker.com and
   enable the service.
4. Firewall, in THIS EXACT ORDER:
       a) ufw allow OpenSSH
       b) ufw allow 80/tcp
       c) ufw allow 443/tcp
       d) ufw allow from 172.28.0.0/24 to any port 9100 proto tcp
       e) ufw --force enable
   Do NOT open 9090, 9100 or 3000 to anyone else.
5. Create ~/monitoring/.env with GRAFANA_ADMIN_PASSWORD set to a random value
   (openssl rand -base64 24), chmod 600. Do not print it.
6. Create ~/monitoring/docker-compose.yml with: prometheus (retention flags
   --storage.tsdb.retention.time=30d and --storage.tsdb.retention.size=20GB,
   named volume at /prometheus, no ports), grafana (admin password from .env,
   GF_AUTH_ANONYMOUS_ENABLED false, GF_SERVER_ROOT_URL https://DOMAIN, no
   ports), node-exporter (host network, pid host, / mounted at /host read-only
   rslave, --path.rootfs=/host), cadvisor only if WANT_CADVISOR is yes
   (privileged, no ports), and caddy (ports 80 and 443 only). Put prometheus,
   grafana, cadvisor and caddy on a network pinned to 172.28.0.0/24.
7. Create prometheus.yml scraping prometheus:9090 (localhost), node at
   172.28.0.1:9100 inside a job named node, and cadvisor:8080.
8. Create the Grafana data source provisioning file pointing at
   http://prometheus:9090 and the Caddyfile: DOMAIN { reverse_proxy grafana:3000 }.
9. docker compose up -d.
10. Tell me to open https://DOMAIN, log in as admin, and import dashboard 1860.
    WAIT for me to confirm.

RULES:
- The ufw ordering in step 4 is not optional. Enabling the firewall before
  allowing OpenSSH locks me out.
- Never publish Prometheus, node_exporter or cAdvisor on a public port. Only
  Caddy has a ports section.
- Never print or log the Grafana password. Check it is non-empty only.
- Do not create alert rules or contact points. Those are mine.
- Nothing destructive. If ~/monitoring exists or containers are running, STOP
  and ask. Never overwrite an existing data volume.

VERIFY, AND SHOW ME THE OUTPUT OF EACH:
- "docker compose ps" -> all containers running
- "docker compose logs caddy | tail -20" -> certificate obtained
- Prometheus targets (via docker compose exec) -> every target health "up"
- "curl -sI https://DOMAIN" -> a successful TLS handshake
- NEGATIVE CONTROLS, run from MY machine, not the server:
      curl -m 5 http://SERVER_IP:9090
      curl -m 5 http://SERVER_IP:9100/metrics
      curl -m 5 http://SERVER_IP:3000
  -> ALL THREE MUST FAIL or time out. If any answers, stop and tell me.
- reboot, wait 60 seconds, then "docker compose ps" -> back up on its own

Then tell me I am not finished until I have added a Telegram contact point,
pressed Test, and deliberately stopped one exporter to confirm the alert lands.

Do not tell me a step succeeded without showing the command output that proves
it. If a verification fails, stop and report the actual error. Do not retry
silently and do not improvise a workaround, especially around the firewall.
Two things in that prompt are worth stealing. It treats "nothing public answers" as a test with its own negative control, because a monitoring stack that leaks its own inventory has failed even when every graph is green. And it refuses to count the install as done until an alert has actually fired.
For the Caddy and HTTPS pattern in more depth, see self-hosting n8n.
Deploy your VPS
The Orbit plan is the right size here: two cores and 4 GB for Grafana and Prometheus, with 50 GB for the time-series data.
- Unmetered bandwidth, no overage
- Free DDoS protection
- Daily automated backups
- Browser console access
Common questions
Do I need Grafana, or is Prometheus enough? Prometheus has a basic query page, but no proper dashboards or friendly alerting. Grafana is what makes the data readable, and it is where the Telegram alerts live in this guide.
Is it safe to expose Prometheus or node_exporter? Not without extra protection. Prometheus has no authentication by default and node_exporter reveals detailed host information. Keep them on a private network or a WireGuard address, and publish only Grafana behind a login.
How long should I keep metrics? Prometheus keeps 15 days if you set nothing. Thirty days suits most small servers. Set a size cap as well so the disk can never fill.
Does this replace Uptime Kuma? No. Metrics show what a machine is doing. An external check shows whether it answers. Run both, on different servers.
How do I update it?
docker compose pull && docker compose up -d from ~/monitoring. The named volumes keep your data and dashboards.