Uptime Kuma is a self-hosted monitoring tool that watches your sites and servers and tells you the moment one stops answering — with a dashboard, status pages, and alerts to Telegram, Discord or email. It's light enough to run on the cheapest VPS there is. About 20 minutes, and one design decision that most guides get wrong.
Using an AI coding agent? There's a ready-made prompt at the end of this guide. Copy that instead of this article.
The mistake to avoid before you start
Almost every guide on this topic installs Uptime Kuma on the server you already have, alongside the thing you want to monitor. Don't do that, and the reason is worth understanding rather than just following.
If the monitor lives on the same machine as its target, then when that machine goes down the monitor goes down with it. No alert is sent, because nothing is running to send one. Your dashboard doesn't go red — it goes unreachable, which looks exactly like your laptop being offline, or the wifi being flaky, or you not having checked. Silence is indistinguishable from health.
That is the whole failure: a monitor that reports "all green" right up until the moment it reports nothing at all. The one event it exists to catch is the one event it cannot report.
So: run Uptime Kuma on a separate, small VPS whose only job is watching the others. That's a $5.99 server. It is genuinely the cheapest insurance in your stack, and it's why this guide recommends our smallest plan without hedging.
And then close the last gap — see Who watches the watcher near the end, because the same logic applies one level up.
What you'll need
- A PrivateByte VPS. The Flare plan ($5.99/mo: 1 vCPU, 2 GB RAM, 25 GB SSD) is plenty. Uptime Kuma is genuinely light.
- A separate server from the things you're monitoring. See above. This is the point.
- A domain name you control the DNS for.
- About 20 minutes. Every command is copy-paste.
Step 1: Deploy your VPS
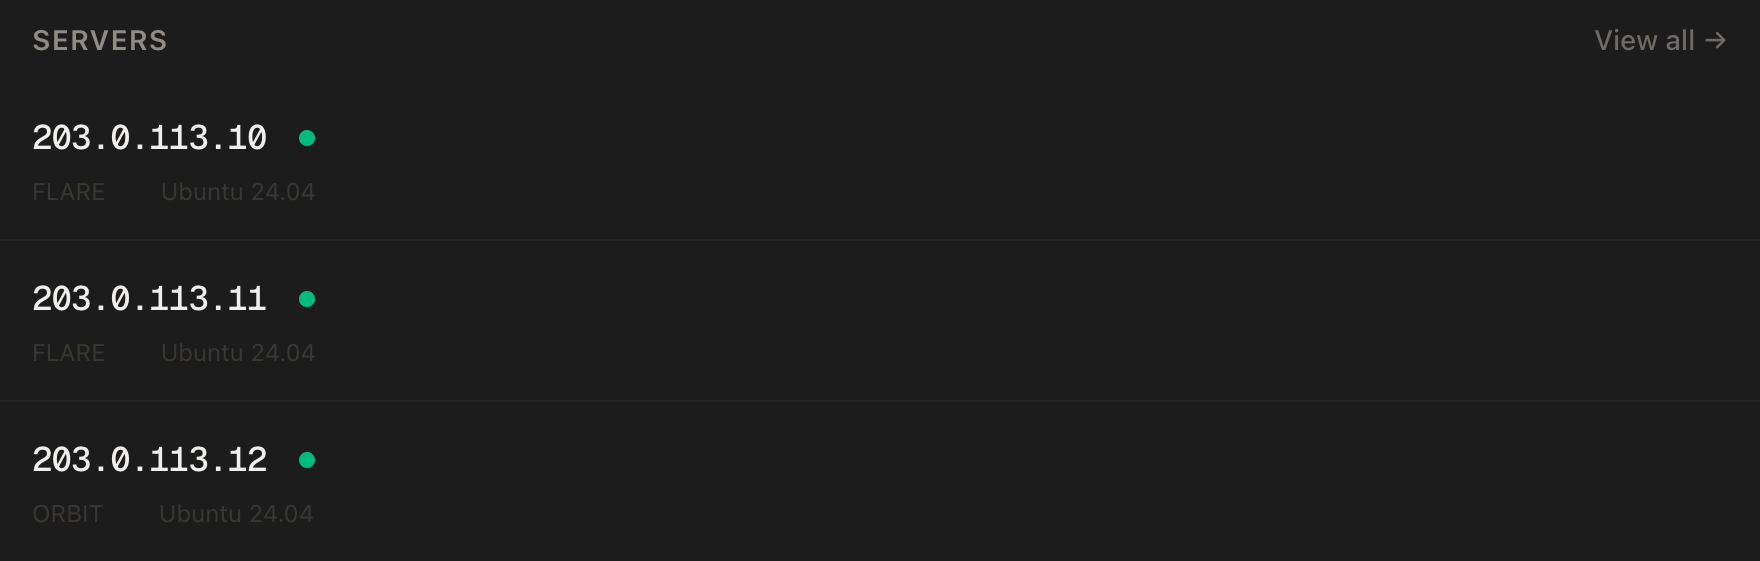
In the PrivateByte dashboard, open the store, choose Flare, pick Ubuntu 24.04, and deploy. Ready in a few minutes.
If you can, put it in a different region from the servers it will watch. A monitor in the same datacenter as its targets will miss a datacenter-level network problem for the same reason a monitor on the same host misses a host failure.
Step 2: Point your domain at the server
| Type | Name | Value |
|---|---|---|
| A | status |
your server's IP |
dig +short status.yourdomain.comThat must return your server's IP before you continue.
Step 3: Connect over SSH
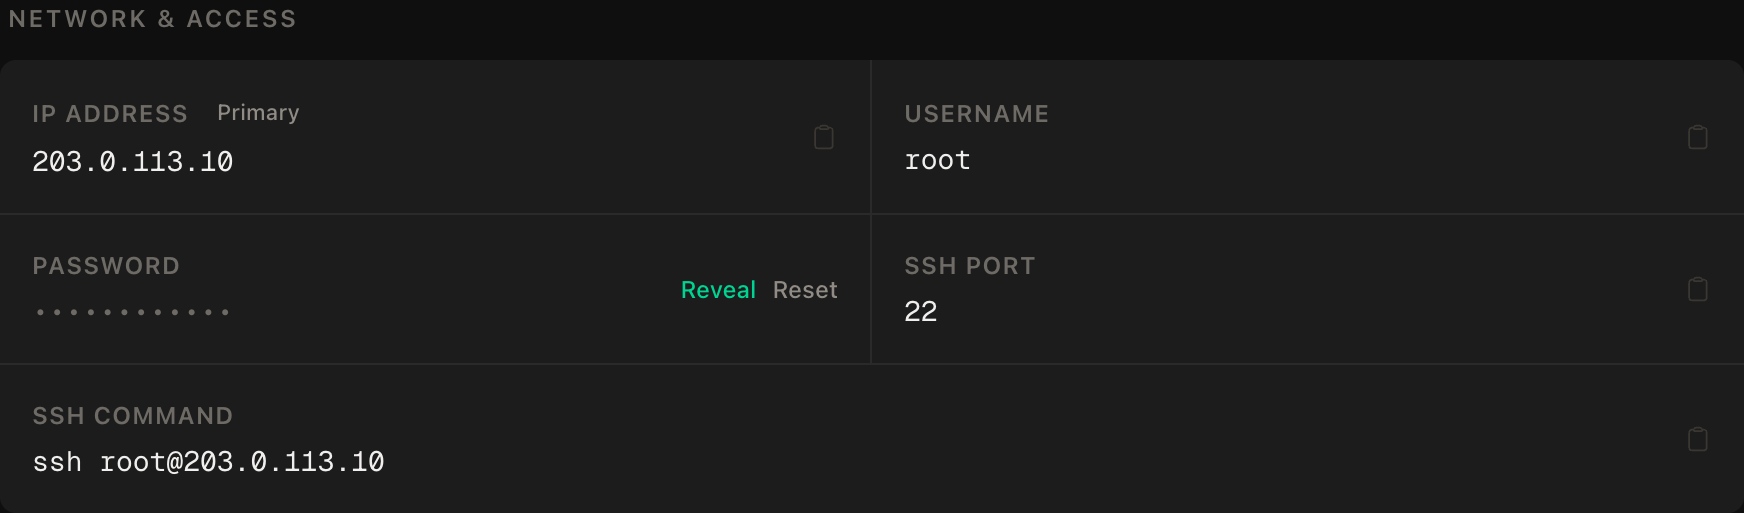
ssh root@YOUR_SERVER_IPWindows users: PowerShell has ssh built in, or use PuTTY. The dashboard also has a browser console if you'd rather install nothing.
ssh command.Step 4: Install Docker
apt update && apt upgrade -y
curl -fsSL https://get.docker.com | sh
systemctl enable --now docker
docker --version
Step 5: Set up the firewall
SSH first, then the web ports, then enable:
ufw allow OpenSSH
ufw allow 80/tcp
ufw allow 443/tcp
ufw --force enable
ufw status
Port 3001 stays closed — Uptime Kuma is reachable only through the HTTPS proxy.
Step 6: Write the configuration
mkdir -p ~/uptime-kuma && cd ~/uptime-kuma
nano docker-compose.yml
services:
uptime-kuma:
image: louislam/uptime-kuma:2
restart: unless-stopped
volumes:
- uptime_kuma_data:/app/data
caddy:
image: caddy:2-alpine
restart: unless-stopped
ports:
- "80:80"
- "443:443"
volumes:
- ./Caddyfile:/etc/caddy/Caddyfile:ro
- caddy_data:/data
- caddy_config:/config
volumes:
uptime_kuma_data:
caddy_data:
caddy_config:Note the tag: :2. Plenty of guides still say louislam/uptime-kuma:1, which pins you to the previous major version. Pinning to a major version rather than latest is right — you just want the current one.
Uptime Kuma has no ports: section, so it's only reachable inside the Docker network.
Now the Caddyfile:
nano Caddyfilestatus.yourdomain.com {
reverse_proxy uptime-kuma:3001
}Uptime Kuma is a WebSocket application — the dashboard updates live rather than polling. A reverse proxy that doesn't forward the Upgrade and Connection headers gives you a page that loads and then never updates, which reads as a broken app rather than a proxy problem. Caddy forwards them by default. On nginx you'd be writing those headers by hand, and this is the single most common Uptime Kuma proxy complaint.
Step 7: Start it
docker compose up -d
docker compose ps
docker compose logs caddy | tail -20
Both containers running, and a line confirming the certificate was obtained. Repeated failures usually mean DNS hasn't propagated — wait, then docker compose restart caddy.
Step 8: Create your account and add monitors
Open https://status.yourdomain.com and create your admin account.
Then check registration is closed: open the site in a private window and confirm you're offered a sign-in and not a way to create a second account. If you can register, find the setting in Settings → Security and close it before you go any further.
Now add monitors. The useful ones aren't all HTTP:
| Monitor type | Use it for |
|---|---|
| HTTP(s) | A site is up and returning 200 |
| TCP Port | A database, an SSH port, a game server |
| Ping | A host is reachable at all |
| HTTP(s) - Keyword | The page loads and contains expected text |
| Push | Something that calls you — cron jobs, backups |
The keyword monitor is the one to reach for. A plain HTTP check passes on any 200, including the cheerful error page your app serves when its database is down. Checking for a word that only appears on a genuinely working page is the difference between monitoring your web server and monitoring your application.
Push monitors invert the check and are the only way to monitor something that isn't reachable from outside — a nightly backup, a cron job. Uptime Kuma gives you a URL, your job calls it on success, and if the call doesn't arrive on schedule you get alerted. That catches the job silently not running, which a normal check never sees.
Step 9: Set up alerts
A dashboard nobody is looking at is not monitoring. Go to Settings → Notifications and add one.
Telegram is the most useful for this: it's instant, it's on your phone, and it's free. You'll need a bot token from BotFather — the same process covered in our guide to hosting a Telegram bot.
Then send a test notification, and don't skip it. An alerting path you have never fired is not an alerting path; it's an assumption. Most people discover their alerts were misconfigured during the incident they were meant to catch.
Verify it works
Add a monitor for something you control, then deliberately break it and confirm you get alerted.
That's the real test, and it's the one people skip. Watching a monitor stay green tells you nothing — a monitor that is broken in a way that always reports "up" looks identical. Stop the service, wait for the check interval, and confirm the alert actually lands on your phone. Then start it again and confirm you get the recovery notification.
Then confirm the whole thing survives a reboot:
rebootWait a minute, reload the dashboard, and check your monitors resumed on their own.
Who watches the watcher
You've solved the original problem — the monitor no longer dies with the thing it watches. But it can still die on its own, and then it stops alerting about everything, silently.
Two ways to close that, both cheap:
- An external check on the Kuma box itself. A free third-party uptime service pointed at
https://status.yourdomain.comis enough. You're not asking it to do much; you're asking it to notice one server. - A push monitor pointed the other way. A cron job on one of your other servers that calls a push URL, so a second system independently expects to hear from this one.
Either turns "my monitoring is silent" from an ambiguous signal into an alert. That's the entire game: never let a failure and a healthy system produce the same observation.
Troubleshooting
The dashboard loads but never updates, and monitors look frozen. The WebSocket connection isn't getting through. On Caddy this shouldn't happen; if you're behind a second proxy or a CDN, that's where to look — some CDN configurations need WebSockets explicitly enabled.
Certificate errors, or the site won't load over HTTPS. Caddy couldn't complete the Let's Encrypt challenge. Confirm dig +short status.yourdomain.com returns your IP, ufw status shows 80 and 443 open, and read docker compose logs caddy. Port 80 must be open — the challenge uses it.
A monitor flaps between up and down. Usually a check interval that's too aggressive, or a timeout that's too tight for a slow endpoint. Raise the timeout first. Also raise "Retries" — that's the setting that stops a single dropped packet becoming a 3am alert.
Ping monitors fail for a host that is definitely up. Plenty of servers drop ICMP by design, including Windows ones. Use a TCP port monitor instead — port 3389 for Windows, 22 for Linux. A failed ping is not evidence a host is down.
Alerts never arrive. Send a test notification from the notification's own settings page. If the test works and real alerts don't, the notification isn't attached to that monitor — it's assigned per-monitor, and it's easy to add a notification and never tick it on anything.
The disk fills up over months. Uptime Kuma keeps heartbeat history indefinitely by default. Set a retention period in Settings → Monitor History.
Do it with an AI agent
If you'd rather hand this to Claude Code, Cursor, or another coding agent, don't paste the article at it. Articles are written for humans, and agents skim the warnings and lose the ordering. Copy this instead, and run it from your own machine with your agent able to SSH out.
Prompt for an AI agent
Set up Uptime Kuma on a fresh Ubuntu 24.04 VPS, behind HTTPS, using Docker and
Caddy.

FILL IN BEFORE YOU START:
- SERVER_IP = <VPS IP from the PrivateByte dashboard>
- DOMAIN    = <the subdomain, e.g. status.example.com>

BEFORE ANYTHING ELSE, CHECK THIS AND STOP IF IT IS WRONG:
This server must NOT be one of the servers I intend to monitor. A monitor on the
same machine as its target cannot alert me when that machine dies, which is the
only moment it matters. Ask me what this box will be monitoring. If any answer
is "this server", stop and tell me to use a separate VPS.

WHAT TO DO:
1. Run "dig +short DOMAIN" and confirm it returns SERVER_IP. If not, STOP — the
   certificate step will fail and everything after it is wasted.
2. SSH to root@SERVER_IP. Confirm Ubuntu 24.04 before changing anything.
3. apt update && apt upgrade -y. Install Docker from https://get.docker.com and
   enable the service.
4. Firewall, in THIS EXACT ORDER:
       a) ufw allow OpenSSH
       b) ufw allow 80/tcp
       c) ufw allow 443/tcp
       d) ufw --force enable
   Do NOT open port 3001.
5. Create ~/uptime-kuma/docker-compose.yml with two services: uptime-kuma
   (image louislam/uptime-kuma:2 — the :2 tag, not :1 — named volume at
   /app/data, and NO ports section) and caddy (caddy:2-alpine, ports 80 and 443,
   ./Caddyfile mounted read-only, named volumes for /data and /config).
6. Create ~/uptime-kuma/Caddyfile containing:
       DOMAIN { reverse_proxy uptime-kuma:3001 }
   Uptime Kuma is WebSocket-based. Caddy forwards the Upgrade and Connection
   headers by default, so nothing extra is needed — but if I later put anything
   else in front of it, WebSockets must pass or the dashboard silently freezes.
7. docker compose up -d
8. Tell me to open https://DOMAIN and create the admin account, then WAIT for me
   to confirm before continuing.
9. Tell me to check in a private browser window that registration is closed, and
   where the setting is if it is not.

RULES:
- The ufw ordering in step 4 is not optional. Enabling the firewall before
  allowing OpenSSH locks me out of my own server.
- Do not create, edit or delete any monitors or notifications. Those are mine.
- Nothing destructive. If ~/uptime-kuma exists or containers are running, STOP
  and ask — never overwrite an existing instance's data volume, it contains all
  the monitor history.
- Do not add this server to its own monitors.

VERIFY, AND SHOW ME THE OUTPUT OF EACH:
- "docker compose ps" -> both containers running
- "docker compose logs caddy | tail -20" -> certificate obtained, no repeated
  failures
- "curl -sI https://DOMAIN" -> HTTP 200 and a successful TLS handshake
- THE NEGATIVE CONTROL, run from MY machine, not the server:
      curl -m 5 http://SERVER_IP:3001
  -> this MUST fail or time out. If it answers, Uptime Kuma is exposed directly
  and the firewall is not holding. Stop and tell me.
- reboot, wait 60 seconds, then "docker compose ps" and "curl -sI https://DOMAIN"
  -> back up on its own

Then tell me, in plain terms, that I am not finished until I have (a) added a
notification channel, (b) sent a test notification, and (c) deliberately broken
one monitored service and confirmed the alert reached me. An alerting path that
has never fired is an assumption, not a monitor.

Do not tell me a step succeeded without showing the command output that proves
it. If a verification fails, stop and report the actual error. Do not retry
silently and do not improvise a workaround, especially around the firewall.
Two things in that prompt are worth stealing for your own agent work. It opens with a question that can stop the whole job — putting the monitor on a machine it monitors is a design error no amount of correct installation fixes, so it's checked before a single package is installed. And it refuses to call the work finished at "the service is running", because for a monitoring tool the running service is the easy half; the part that matters is whether an alert actually reaches a human.
The Caddy and automatic-HTTPS setup here is the same one used for self-hosting n8n. If what this box ends up watching is an app you deployed yourself, deploying a Node app with a domain and HTTPS is the other half of that job.
Deploy your VPS
A small server whose only job is watching your other servers is one of the highest-value things you can run, and one of the cheapest.
The Flare plan is genuinely the right size — Uptime Kuma is light, and this is a recommendation for our smallest plan rather than a nudge upward.
- Unmetered bandwidth, no overage
- Free DDoS protection
- Daily automated backups
- Browser console access
Common questions
Can't I just run Uptime Kuma on a server I already have? You can, and it will appear to work. But it cannot alert you when that server fails, which is the main thing you wanted. A separate $5.99 box removes that blind spot entirely, and it's the reason this guide exists in the shape it does.
How many things can one instance monitor? Dozens comfortably on the smallest plan. The load is a handful of outbound requests per check interval, not sustained work — the resource that runs out first is usually disk from heartbeat history, not CPU.
Does it work for things behind a firewall? Not with normal checks, since it can't reach them. Use a push monitor: the private system calls Uptime Kuma on success, and you get alerted when the expected call doesn't arrive.
Can I show a public status page? Yes, that's built in. You can publish a status page on its own domain, choose which monitors appear, and post incident updates — without exposing the admin dashboard.
How do I update it?
docker compose pull && docker compose up -d from ~/uptime-kuma. The named data volume keeps your monitors and history across the upgrade.